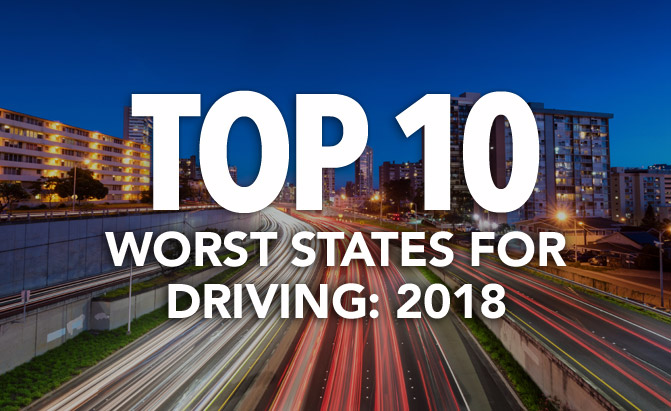
A recent study has revealed 2018’s top 10 worst states for driving.
To help identify the worst states for driving, WalletHub compared the 50 states in the U.S. across four key dimensions: Cost of Ownership & Maintenance, Traffic & Infrastructure, Safety, and Access to Vehicles & Maintenance.
Those dimensions were analyzed using 23 relevant metrics with specific weights, and each metric graded on a 100-point scale. An overall score for each state was calculated by determining each state’s weighted average across all metrics.
SEE ALSO: Top 5 States with the Worst Drivers: 2017
Some of the states on the top 10 list may not come to a surprise to you, especially if you live in one of them.
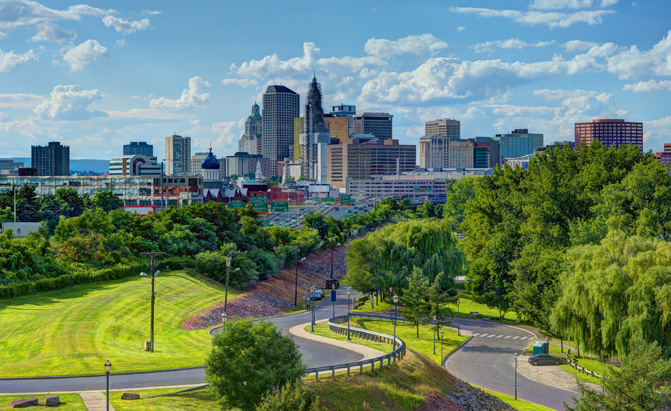
10. New York

New York finishes with a total score of 49.99, ranking 48th overall in Cost of Ownership & Maintenance and 47th in Traffic & Infrastructure. It was however, ranked first for Safety and fourth for Access to Vehicles & Maintenance.
New York was one of the states with the most days of precipitation and had the highest auto maintenance costs overall. In addition, it does get recognized as the state with the fourth-lowest car theft rate in the country.
9. New Jersey

Neighboring New Jersey didn’t fare much better, with a total score of 49.56. New Jersey ranked 42nd overall in Cost of Ownership & Maintenance and 49th in Traffic & Infrastructure. But like New York, it was one of the best states for Safety and Access to Vehicles & Maintenance, ranking sixth and 12th, respectively.
The state does however, have one of the highest percentages of rush-hour traffic congestion. New Jersey also ranked fifth overall when it comes to most car washes per capita.
8. Rhode Island
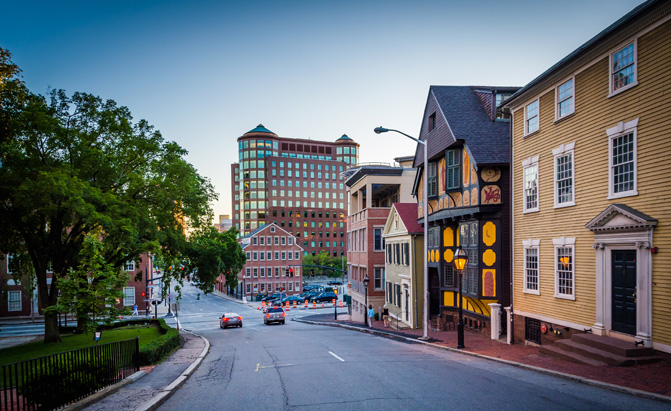
Next is Rhode Island, scoring 49.49. It ranked second in Safety, but struggled in all the other categories. Rhode Island finished 41st overall in Cost of Ownership & Maintenance, 44th in Traffic & Infrastructure, and 46th in Access to Vehicles & Maintenance.
Rhode Island was also one of the states with the highest percentage of rush-hour traffic congestion, and the fewest car washes per capita.
7. Massachusetts
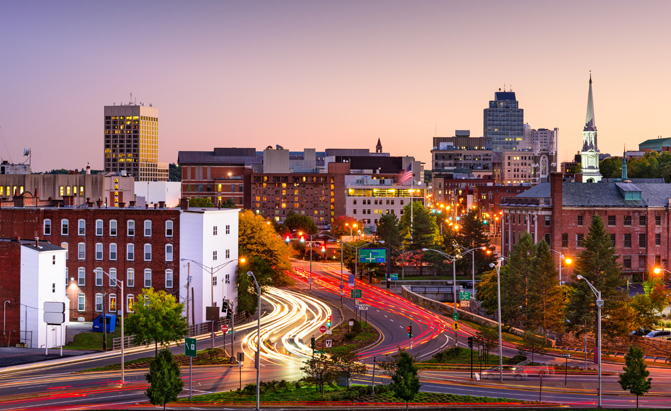
While Massachusetts did finish fourth in Safety and ninth in Access to Vehicles & Maintenance, the state is the worst when it comes to Traffic & Infrastructure. It didn’t do too well in Cost of Ownership & Maintenance either, ranking 40th overall. The state had a total score of 49.19.
Massachusetts also gets the honors of being one of the states with the highest auto maintenance costs.
6. Alaska
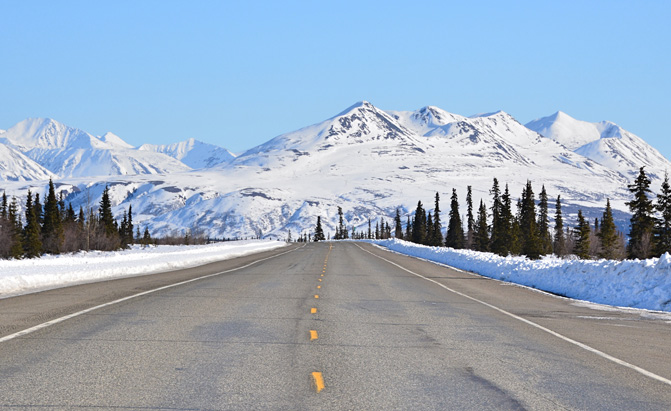
Alaska is the worst state when it comes to Access to Vehicles & Maintenance, with a total score of 48.69. The state finished 43rd in Cost of Ownership & Maintenance, 24th in Traffic & Infrastructure, and 17th in Safety.
Alaska also joins the top 5 list of states with the most days of precipitation and highest car theft rate. It also has the fewest auto repair shops per capita in the entire country, and is one of the states with the fewest car washes per capita. It also ranks third when it comes to highest average gas prices.
5. Connecticut
In the middle of the pack is Connecticut, scoring 48.67. The state did rank third when it comes to Safety, but finishes 47th in Cost of Ownership & Maintenance, 45th in Traffic & Infrastructure, and 24th in Access to Vehicles & Maintenance.
4. California
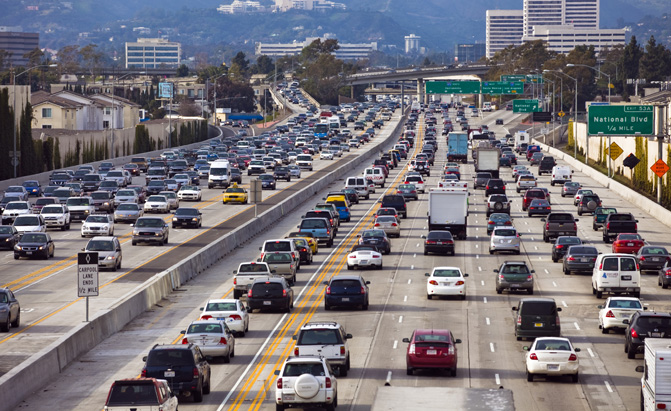
California residents, believe it or not, your state is not the worst for driving. Ranked fourth for 2018, California has a total score of 48.60. It tops the country when it comes to Access to Vehicles & Maintenance, but it ranked 49th overall in Cost of Ownership & Maintenance. It was also one of the worst states for Traffic & Infrastructure, finishing in 42nd place, while Safety ranks 18th overall.
California is home to the highest percentage of rush-hour traffic congestion, and has the second highest car theft rate in the U.S. The state is also recognized for having the second-highest average gas prices. What it does well however, is having the most auto repair shops and car washes per capita in the entire nation. It also has the fewest days with precipitation.
3. Maryland

Kicking off the top 3 worst states for driving in 2018 is Maryland, scoring 48.31. The state didn’t excel in any particular category, ranking 35th in Cost of Ownership & Maintenance, 48th in Traffic & Infrastructure, 16th in Safety, and 21 in Access to Vehicles & Maintenance.
Maryland is behind California when it comes to highest percentage of rush-hour traffic congestion.
2. Washington

Washington state isn’t great for driving either, scoring 44.08. Along with ranking 49th overall, the state is 45th in Cost of Ownership & Maintenance, 39th in Traffic & Infrastructure, 36th in Safety, and 17th in Access to Vehicles & Maintenance.
Washington is also home to one of the highest car theft rates in the U.S., and is fourth-highest when it comes to average gas prices.
1. Hawaii
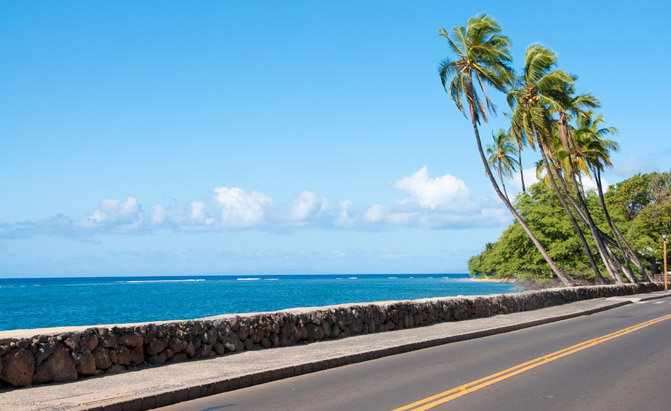
The worst state for driving in 2018, based on WalletHub’s study, is Hawaii. And it’s really no competition, with the state scoring 31.83. It’s the worst state when it comes to Cost of Ownership & Maintenance, while finishing 46th in Traffic & Infrastructure, 34th in Safety, and 43rd in Access to Vehicles & Maintenance.
It ranked second highest when it comes to days with precipitation, and has one of the fewest number of auto repair shops per capita. Hawaii also finished last in fewest car washes per capita and has the highest average gas prices in the U.S. If that wasn’t enough, it’s ranked second-highest when it comes to auto maintenance costs.
Leave a Reply